ON THIS PAGE
December 3, 2020


Our People
How We Measure The Impact of Design
In the second in a series of blogs, we discuss how design is being measured at Veriff, and how it helps us to make certain decisions.
At Veriff, our approach to design is systematic as well as data-driven. That means our design language is consistent, we use design systems and patterns, we measure the impact of our design and we make decisions based on the data we have collected.
Communicating the value of design is something that often proves challenging, in any organization. It is difficult to connect the dots between design and business. This can lead to design being under-valued within the organization. Though the design field has matured a lot during the past decades, design is too often described as being subjective. When someone says design is subjective, it means design is based on personal feelings, tastes, or opinions. Objective design is rather based on research, both quantitative and qualitative data, leaving personal feelings or opinions aside.
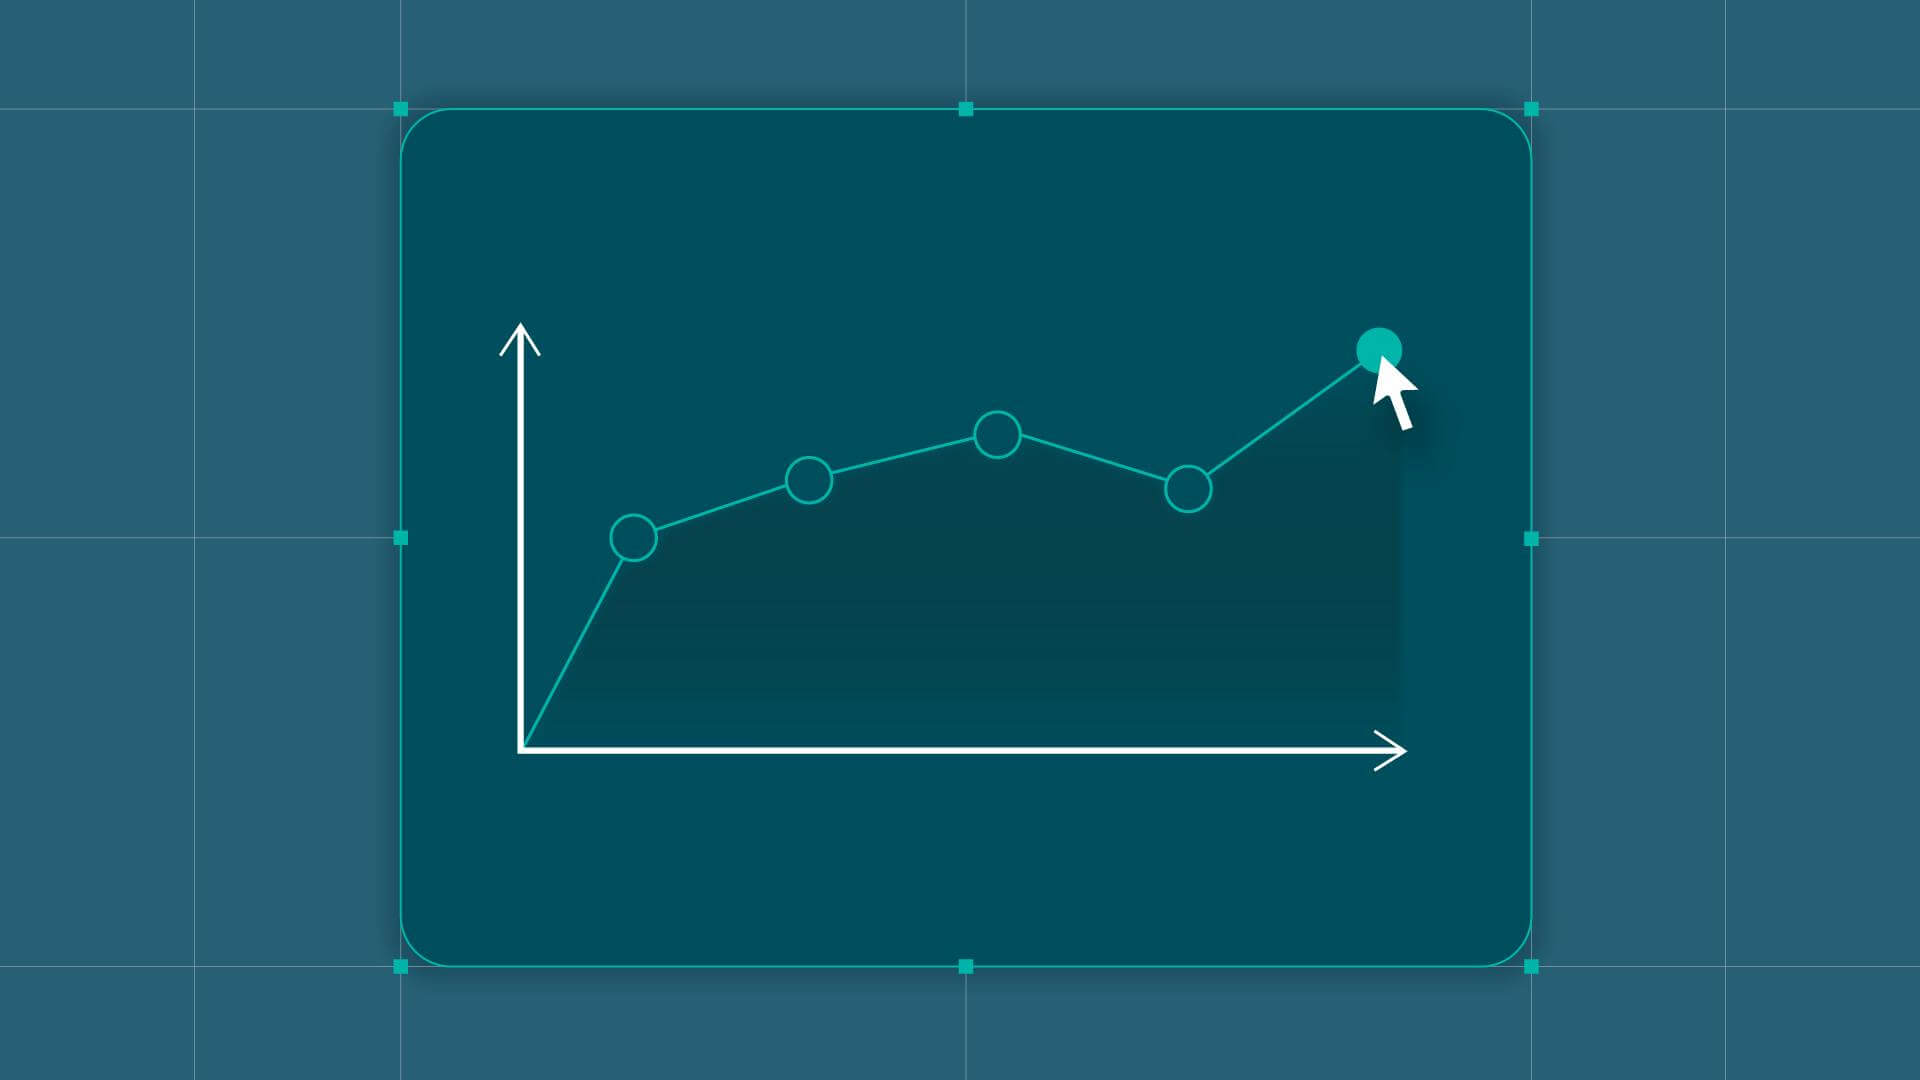
In order to make the shift of bringing design from subjective to objective – we need metrics. Metrics help us to demonstrate the impact of design in a tangible way, prove the effort was worthwhile, find answers to design discussions, make decisions, learn from our mistakes and successes, and connect the dots between design and business growth.
How do you measure design?
Basically, you need to figure out your goals. The most commonly used metrics are retention, churn and conversion. At Veriff, we use OKRs to connect company, team, and personal goals to measurable results while having all our team members and leaders work together in one, unified direction. That approach applies to design and designers as well. Before each quarter we set (design) team level OKRs that are connected with the company’s for the next 3 months.
Step #1: Define your goals
Let’s use the example of launching a new design update. How do we know if the update is successful or not?
We do our research, collecting both quantitative and qualitative data, synthesizing and analyzing the information. However, one can never be 100% sure until the feature or update is live and we can gather real-life data and feedback from the users.
The easiest way to know if your design update was successful or not is to make it measurable using quantitative metrics. Here are some examples:
- Number of people who visited your website
- Number of people who signed up
- Number of people who are using your product on a regular (daily/weekly) basis
- Number of people who completed a certain task
- Number of people who passed the funnel
Once you know what your goals are, it is easier to both measure the impact and to actually decide in the first place, what you should focus on and prioritize based on that.
Step #2: Set hypothesis
In science, a hypothesis is an idea or explanation that you then test through study and experimentation. In design, a theory or assumption can also be called a hypothesis. At Veriff, we do our best to measure our design in order to understand the impact. Before every experiment, we set one or more hypotheses. For example:
- New illustrations help users to understand what they have to do better, therefore conversion rate will increase.
- Showing real-time, onscreen feedback to the user, will increase the funnel conversion rate.
- Consistent navigation experience helps users to find a specific page and increase the funnel conversion.
- Onboarding will increase the number of weekly active users.
Step #3: Test
We have talked about setting goals and hypotheses but you also need to test your designs in order to tell. At Veriff we A/B test every single design update and feature before releasing it to the full user base. The idea of A/B testing is to present different content to different user groups, measure it, gather data, and use the results to make conclusions and decisions.
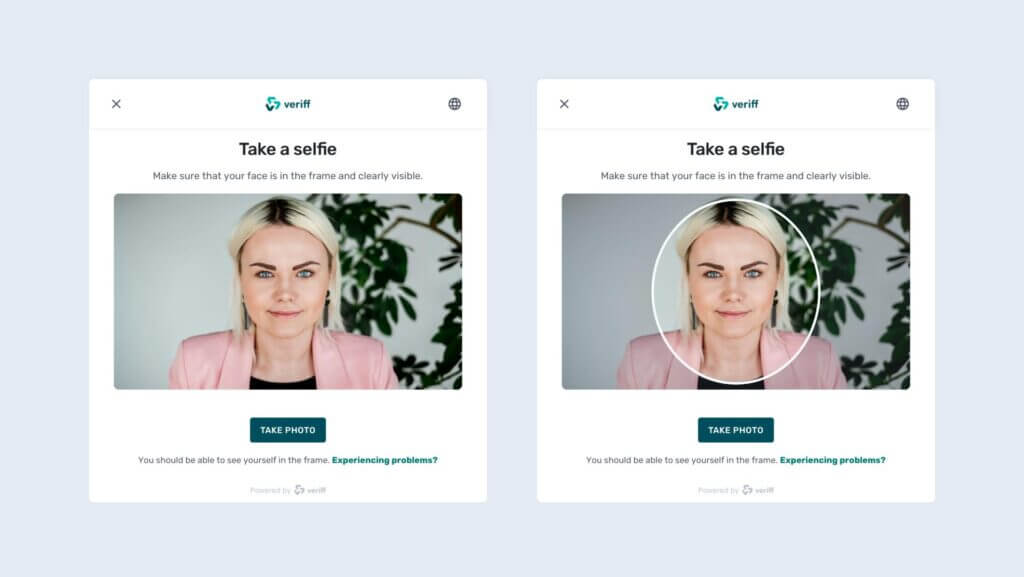
I’ll give you some illustrated examples to demonstrate the idea better.
Our objective was to increase conversion rate. However, we had two hypotheses in the team: one, stating that users who see the photo frame have a higher conversion rate than those who do not, and another stating that it doesn’t matter.
We decided to test the idea in two groups:
- Group A (or the control group) didn’t see the frame when taking photos
- Group B saw the frame when taking photos
Statistically speaking, it is of utmost importance to have a considerable sample size for the results to be reliable. For that reason, we use the Bayesian equation to find out if the test results are statistically significant.
You can try out this simple Bayesian A/B testing calculator to find out if the results of your A/B test are statistically significant.
Once the results came in, it appeared that group A had a conversion rate of 74,55% and group B had a conversion rate of 74,88%.
Was the test useful at all?
The test showed us that having a photo frame doesn’t have any statistically significant effect on our business KPIs i.e. conversion rate. That was something that needed to be proven. It is also something that could help you to finish ongoing design discussions inside the team and take design from being subjective to objective. The reason why I decided to demonstrate an example as such, is because that’s what happens in real life. Testing your designs doesn’t always have to mean having over 10% increase or decrease in your metrics. It’s about understanding what matters and what doesn’t.
Here’s another example of how A/B testing has helped us to validate our research findings as well as measure the impact of our design.
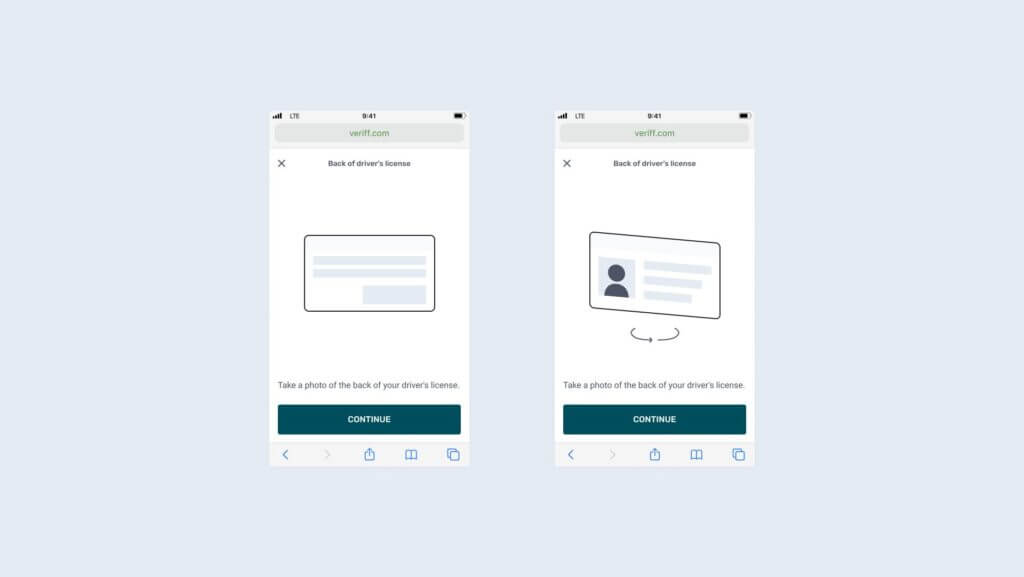
Our research team was investigating problems in our funnels, which led us to develop the hypothesis that our users don’t understand they have to take photos of both sides of their document in the case of an ID card or driver’s license for Identity Verification. Design proposed a solution that used an animation showing the user how to turn around the document, instead of visualizing it with a static image.
We decided to A/B test the idea. The objective of this task was to understand if the animation on the document back instructions screen has a positive or negative impact on the conversion rate. Again, we tested it on two groups – group A who didn’t see the animation and group B who did.
As a result, conversion rate improved 2.7% with 99% probability of feature enabled being the best choice. It was a definitely successful experiment and we rolled it out to the whole user base.
Conclusion
The design field has developed and matured to the point where we have the knowledge, experience and tools in order to communicate the value of design outside the design team. Metrics give us powerful ways to explore, learn and elevate the role of design. It is important as a designer to understand your goals, test your ideas and show how design can lead the way in achieving business targets.