Measuring the Impact of a Design System
Veriff Senior Software Engineer, Rauno Freiberg gives us an inside look into the experience of building our new internal design system, Genoma.

Rauno Freiberg
A few months ago I joined Veriff to kickstart the development of our design system, Genoma. Our goal with Genoma is to enable productivity and faster prototyping, allowing our designers and developers to focus on actual creative work rather than pixel pushing or copy-pasting code.
So far, we have managed to launch 15 components into production, with over 130 occurrences of said components in 6 different products.
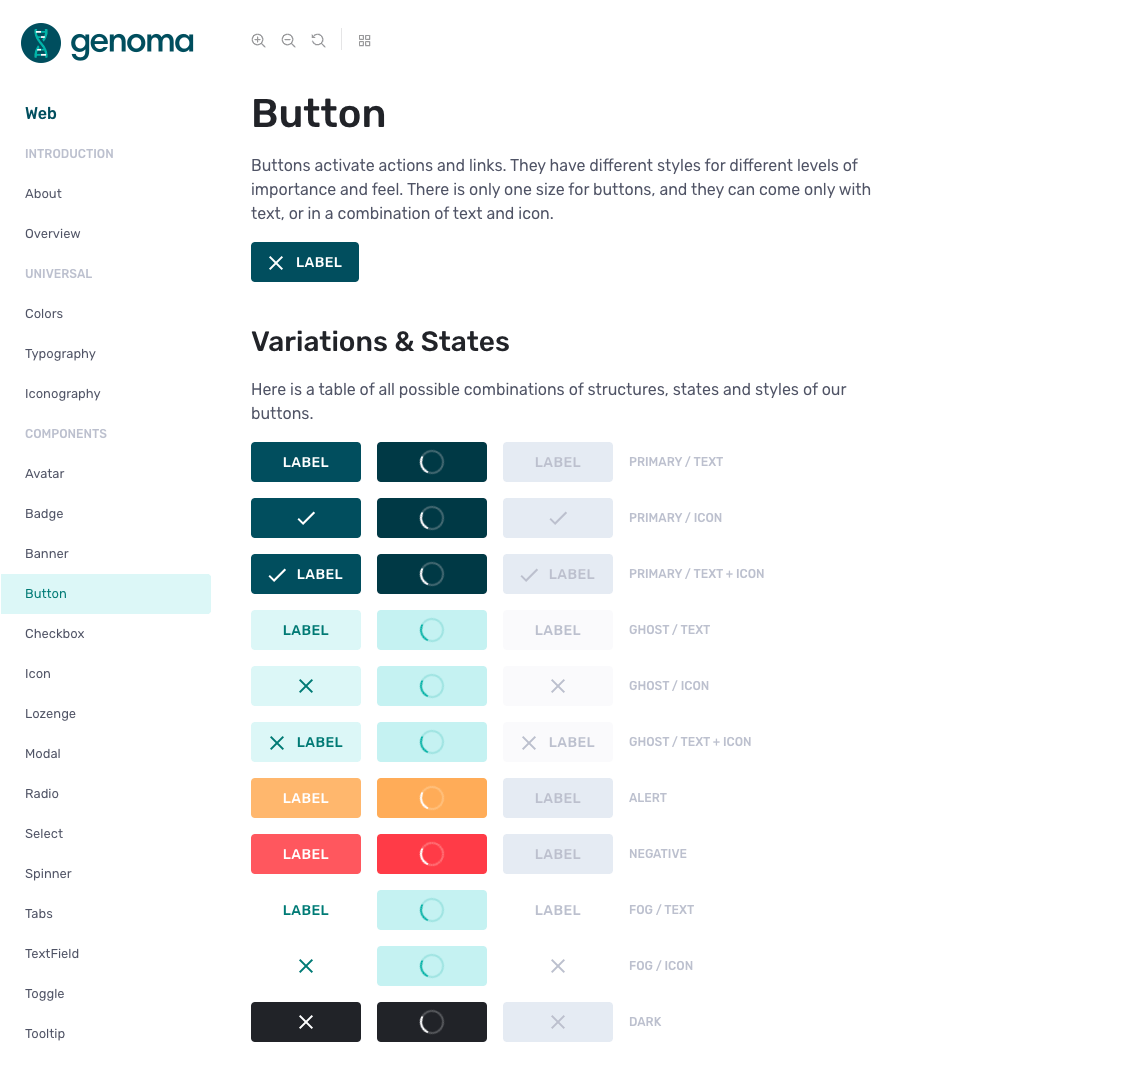
(An example of a component in our design system after launching our new visual brand identity)
Shortly after joining and shipping the first components, product teams started adopting them incrementally. This was done by either refactoring custom components or using new ones out of the box. I realized that tracking this growth manually was not scalable and started thinking, how can we have an overview of all the products using Genoma and what could we learn from it?
The initial prototype
As with all seemingly great ideas, I think it makes sense to test them before fully committing. So a few months ago, during a boring and rainy Sunday evening, I did just that.
Since all of our code is stored on Github and all of our front end is based on React, fetching the required data was simply a matter of searching for code references against the usage of Genoma via Github API. From this, I was able to identify products using Genoma, extract the imported components, and measure the impact.
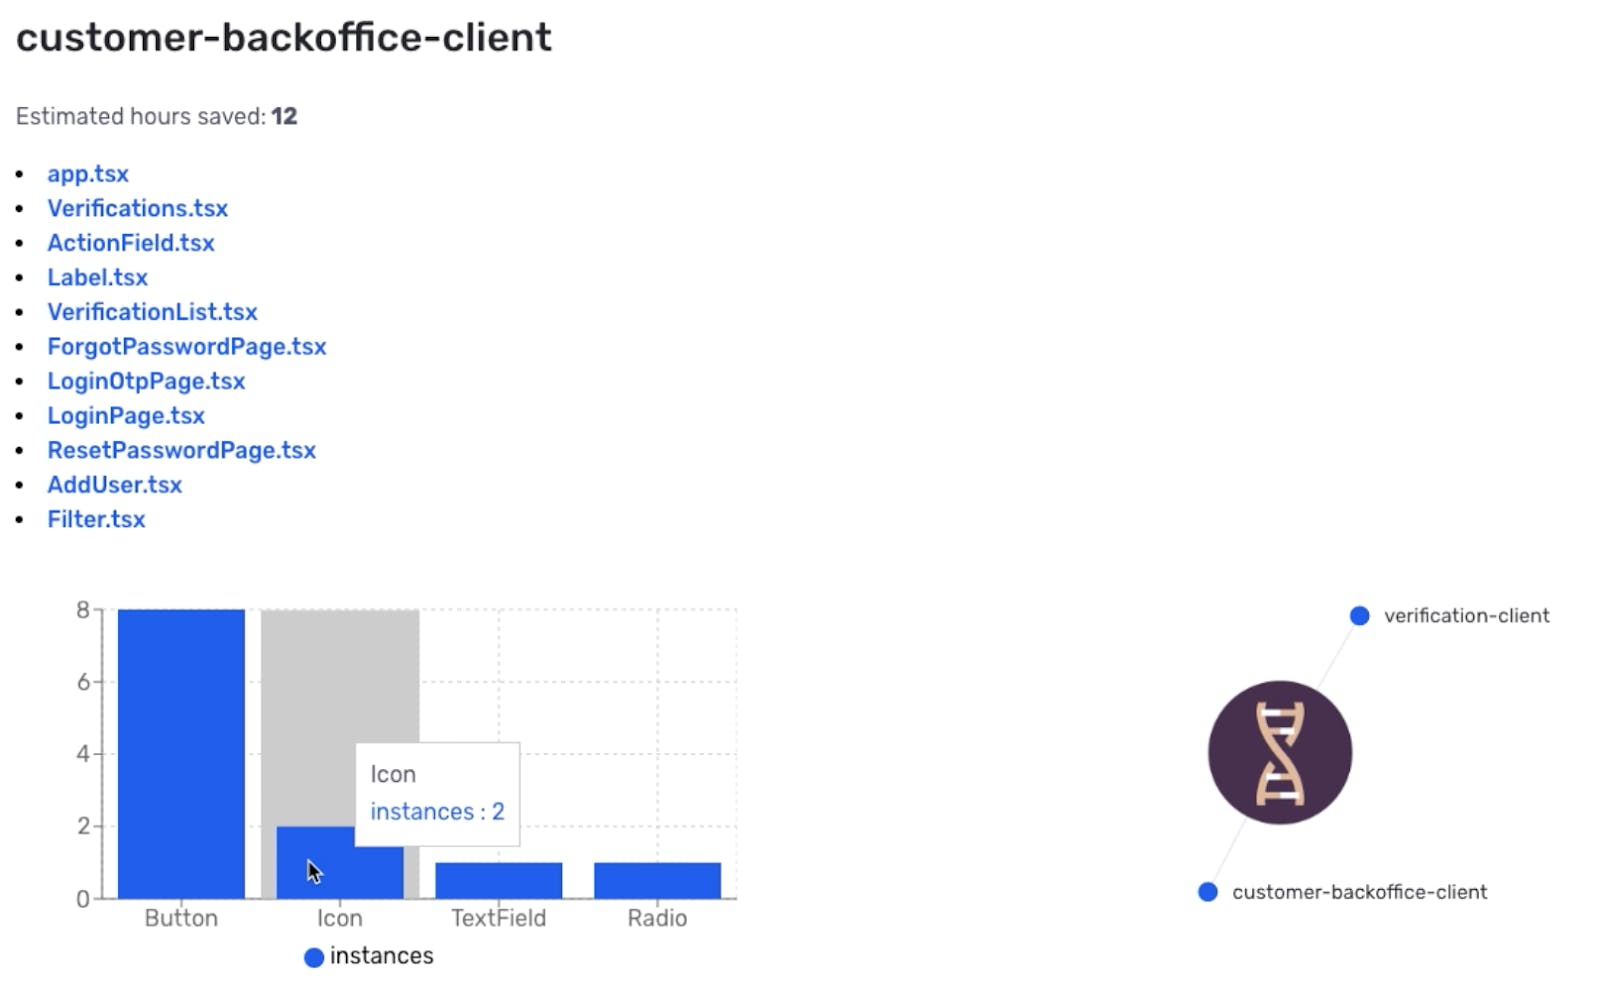
The dashboard started as a node graph of all the products using Genoma (and at the time we didn’t have many). I quickly realized that this approach had a crucial problem: only the current state of the product is shown, and there was no historical data available.
Observing products as they progress
After learning from the initial prototype, we realized that we wanted to improve the dashboard in several ways.
Firstly, we wanted to come up with a metric for measuring the progress of a product. Based on the used components we came up with the concept of adoption rate. The adoption rate shows, percentage-wise, how much of Genoma the product is using.
Since not all products are equally complex or have equivalent requirements, measuring the absolute usage of components wouldn’t quite work. That is why we chose to compare the components that the product could use versus the components that were being used.
To do this, we defined a set of required components for every product and compared the used components against the required ones. The requirements are quite simple to map out, considering the fact that all of our products have an in-house custom design and we know exactly which components make up a product. It was mostly a question of “which components are needed to make this product?”
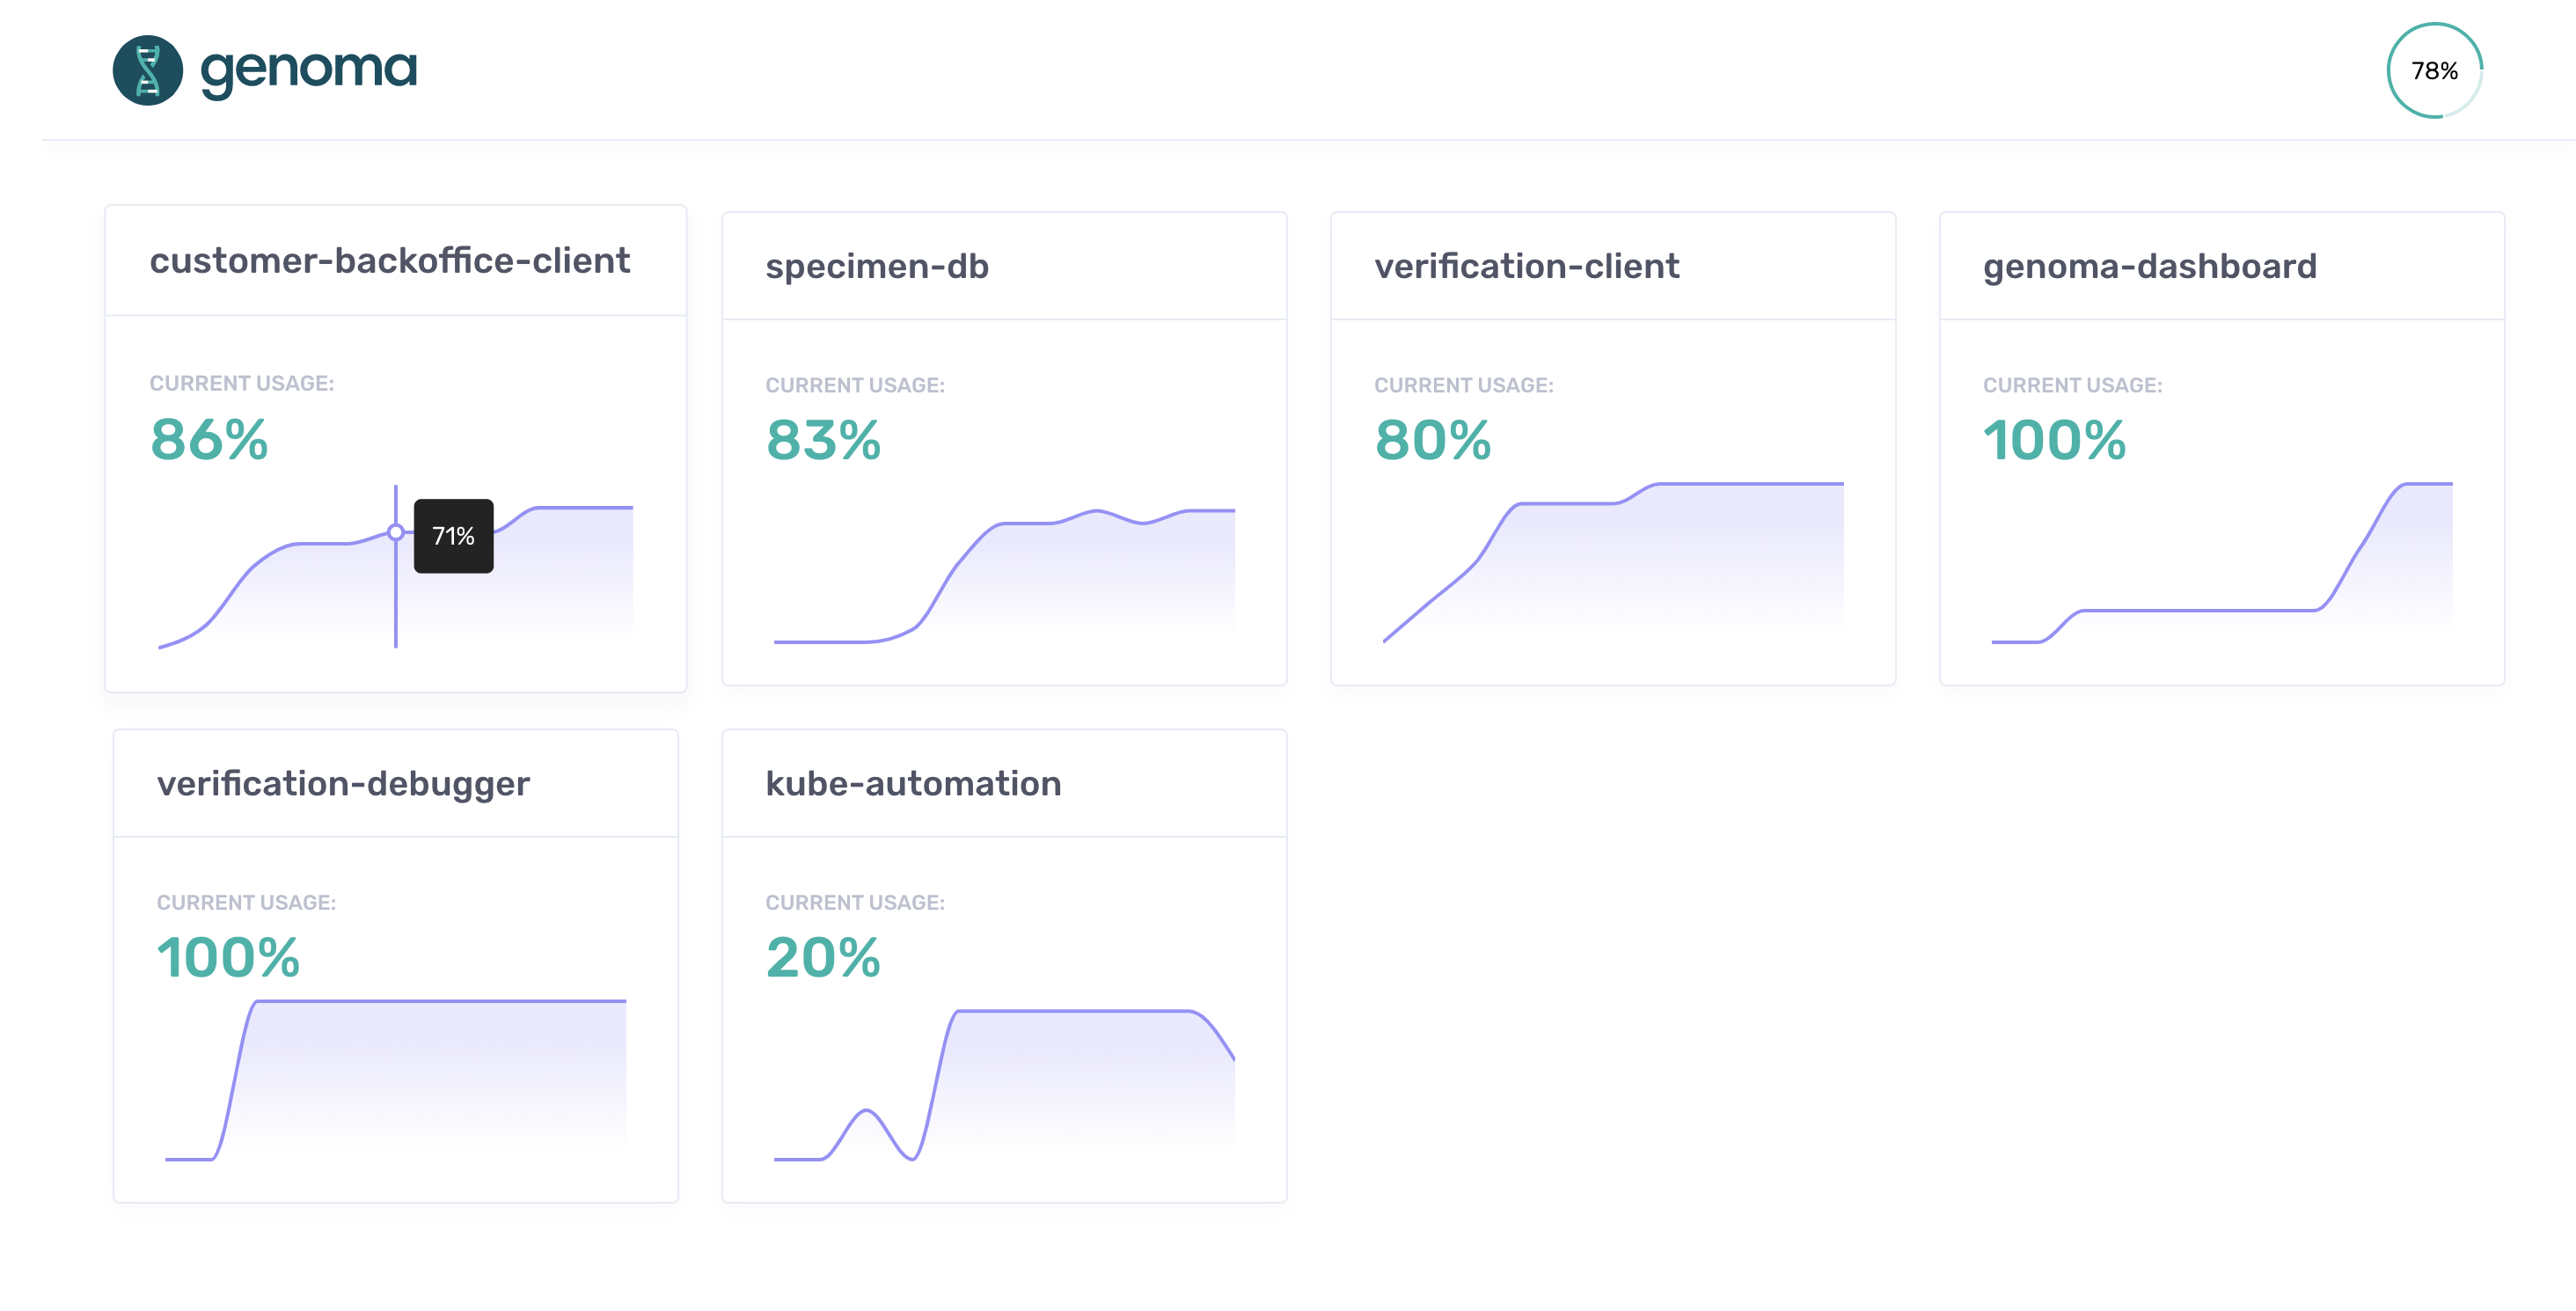
With the adoption rate in place, we could then enable more specific tracking and add historical data points to observe products as they progress. To do this, we started persisting the data periodically. It was then possible to see how different products mature over time and draw some conclusions.
Drawing conclusions
(The product observed in the dashboard is our recently launched platform, Veriff Station 😉)
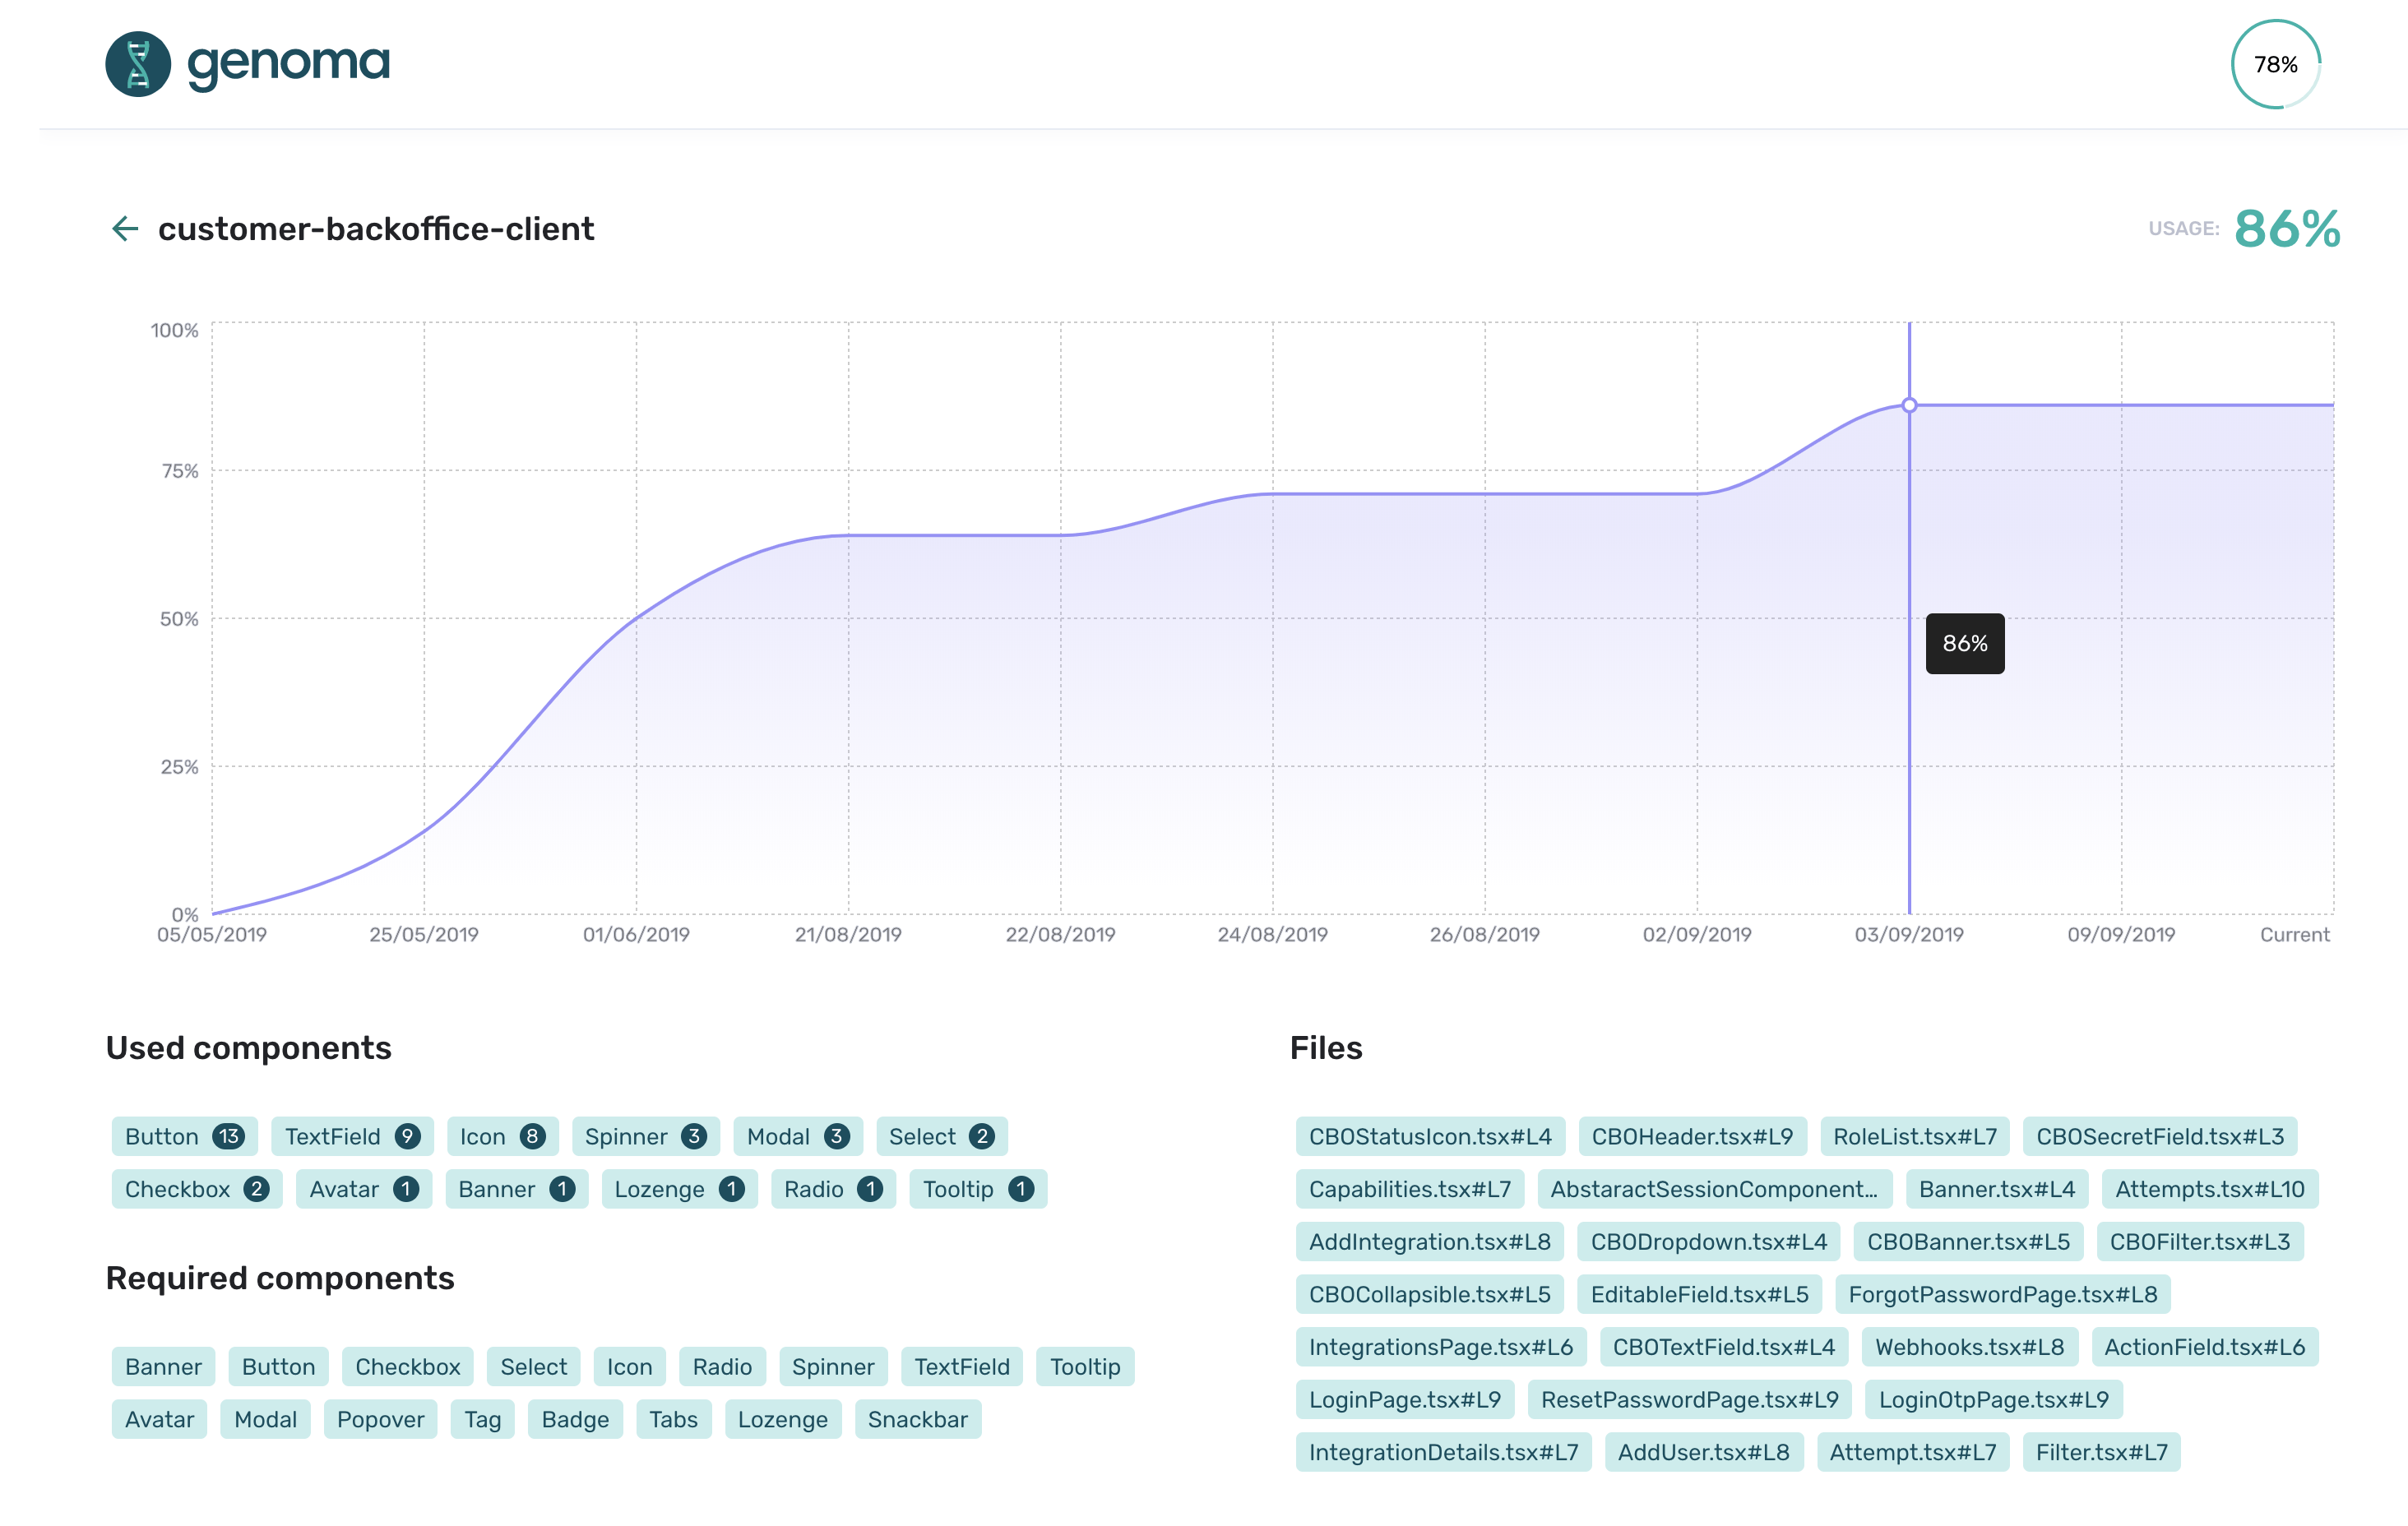
The improved dashboard gave us a lot more insights for each product, making it possible to observe and draw conclusions based on fluctuations in the adoption rate.
Having an overview of all the components (along with the referenced files) that each product is using at a specific point in time allows us to see which components are used the most and which are used the least. Based on this, we can select which components to develop next, which to improve further, and which ones to drop entirely (if unused). It also provides documentation for developers as they can find examples of a certain component being used in an actual product.
After noticing a sudden increase in the adoption rate of a specific product, we can say with a high degree of confidence that the components being shipped are useful. On the other hand, a drop in the adoption rate is not necessarily a bad thing. It can simply suggest that the requirements of the product changed. Either way, the very nature of being able to examine these changes and draw conclusions is already a massive benefit in itself.
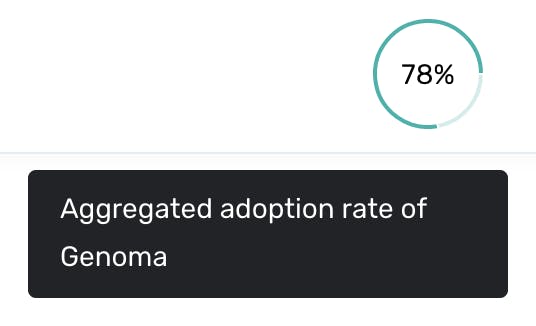
Additionally, having adoption rates per product means that we’re able to aggregate these rates into a Genoma adoption rate. This makes it possible to observe the overall growth of our design system in all Veriff products.
On a personal note, seeing the impact of my work has always been a big motivator, and being able to time travel and compare a product from two months ago to today, while seeing substantial growth, is a huge morale boost.
Where to next?
We are still learning the ins and outs of building a design system, let alone measuring it. There does not seem to be a definitive answer to doing either the right way, which means that we figure out a lot of these things as we go along, but that’s the fun part.
Seeing the foundation that we’ve built so far, both in terms of components and internal tooling, makes me very proud, excited, and certain that even cooler things are yet to come.
Considering a career in cybersecurity? Learn more about life at Veriff here.
